


Abstract
A list of standard reference frequency values (LoF) of quantum transitions from the microwave to the optical regime has been recommended by the International Committee for Weights and Measures (Comité international des poids et mesures, CIPM) for use in basic research, technology, and for the metrology of time, frequency and length. The CIPM LoF contains entries that are recommended as secondary representations of the second in the International System of Units, and entries that can be used to serve as realizations of the definition of the metre. The historical perspective that led to the CIPM LoF is outlined. Procedures have been developed for updating existing, and validating new, entries into the CIPM LoF. The CIPM LoF might serve as an entry for a future redefinition of the second by an optical transition.

Original content from this work may be used under the terms of the Creative Commons Attribution 3.0 licence. Any further distribution of this work must maintain attribution to the author(s) and the title of the work, journal citation and DOI.
1. Introduction and historical perspective
Since the redefinition of the unit of length in the International System of Units (SI) [1] by the 17th General Conference of Weights and Measures (Conférence générale des poids et mesures, CGPM) in 1983 [2] the metre has been defined via the adopted value of the speed of light in a vacuum c0 = 299 792 458 m s−1. The fixed numerical value for the speed of light c0 = λ · ν links the vacuum wavelength λ and the frequency ν of any plane electromagnetic wave. Consequently, each radiation whose frequency can be traced back to the primary standard of time and frequency, i.e. the caesium atomic clock, represents at the same time a unified standard of frequency, time and length.
In parallel with the redefinition of the metre, the 17th CGPM invited the International Committee for Weights and Measures (Comité international des poids et mesures, CIPM) to draw up instructions for the practical realization of the new definition of the metre, and to choose radiations which can be recommended as wavelength standards for the interferometric measurement of length and to itemise operating procedures for their use, and finally to pursue studies to improve these standards. These recommendations for the practical realization of the definition were generally referred to as the mise en pratique of the definition. In turn, the CIPM recommended that the metre be realized by one of the following methods:
- (a)by means of the length l of the path travelled in a vacuum by a plane electromagnetic wave in a time t; this length is obtained from the measured time t, using the relation l = c0 · t and the value of the speed of light in vacuum c0 = 299 792 458 m s−1;
- (b)by means of the wavelength in vacuum λ of a plane electromagnetic wave of frequency f; this wavelength is obtained from the measured frequency f, using the relation λ = c/f and the value of the speed of light in a vacuum c0 = 299 792 458 m s−1;
- (c)by means of one of the radiations from the list of recommended radiations [2], whose stated wavelength in a vacuum, or whose stated frequency, can be used with the uncertainty shown, provided that the given specifications and accepted good practice are followed.
The CIPM also recommended that, in all cases, any necessary corrections should be applied in order to take account of actual conditions such as diffraction, gravitation, or imperfection in the vacuum.
These three methods are essentially only two: a time of flight method and an interferometric method. The latter method uses a radiation of known vacuum wavelength that can be related to the SI frequency of the plane wave used in interferometry, either by a direct measurement or by reference to one of the recommended vacuum wavelengths of validated light sources. The mise en pratique for the definition of the metre was updated on several occasions by the Consultative Committee for Length (CCL) and its Mise en Pratique Working Group (MePWG) [3–6] thereby progressively improving the realization of the definition of the metre (figure 1). For practical length measurements, soon the uncertainty due to the realization of the length unit by optical wavelength/frequency standards became negligible: the practical measurement of the length of a gauge block in an interferometer is limited to about 10−8 [7–9], mostly determined by the properties of the artefact itself and the refractive index of air. Even for interferometric displacement measurements the diffraction correction will place a technical limit. As an example, consider the diffraction correction for a Gaussian beam of waist w0 = 0.1 m and a wavelength of 500 nm which would amount to 6 × 10⁻¹³ [10].
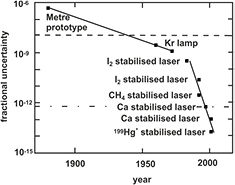
Figure 1. Evolution of the fractional uncertainty in realizing the metre according to the mise en pratique together with two practical limitations i.e. the fractional uncertainty when measuring the length of a gauge block (dashed line) and the fractional uncertainty introduced by the diffraction correction in an interferometric length measurement (dashed–dotted line; see text).
Download figure:
Standard image High-resolution imageThe use of laser cooling of absorbers [11, 12], improved frequency stabilisation techniques, the development of phase coherent frequency measurement chains [13] and later the invention of femtosecond frequency combs [14] had, furthermore, two important consequences: firstly, the broad availability of femtosecond frequency combs allows each laboratory that has access to such a device and a primary caesium clock to directly measure the frequency of any desired laser. Hence, the laser standards in the mise en pratique (method (c)) lose, to some extent, their importance by virtue of the direct realization by method (b). Secondly, the most advanced frequency standards in the mise en pratique had acquired low uncertainties that were orders of magnitude better than the uncertainties that could be made use of in length metrology. As a result, they became more interesting for other fields apart from length metrology, e.g. in basic research [15], ultra-high precision spectroscopy [16] or for optical atomic clocks. Consequently, in 2001 the mise en pratique was renamed ‘Practical realization of the definition of the metre, including recommended radiations of other optical frequency standards (2001)’ [5].
In general, it was expected that such optical frequency standards and other microwave frequency standards would demonstrate reproducibility and stability approaching that of primary caesium. It was considered that these systems could be used to realize the second, provided their accuracy was close to that of caesium, but accepting that their uncertainty could obviously be no better than the caesium uncertainty while the latter remained the primary frequency standard. Today, the most advanced optical frequency standards have evolved to optical clocks that outperform the best microwave clocks with respect to their uncertainty (figure 2) and instability.
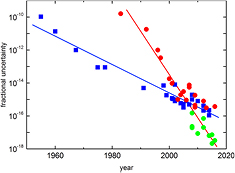
Figure 2. Evolution of the fractional uncertainty in realizing the unperturbed line centre in order to determine the unperturbed quantum transition frequency of primary atomic caesium clocks (squares) and of optical frequency standards (dots). Red dots show the fractional uncertainties of optical frequency standards directly related to the caesium atomic clock, green dots refer to published estimated standard uncertainties to realize the unperturbed line centre.
Download figure:
Standard image High-resolution imageAdditionally, and most importantly, the femtosecond optical frequency comb offered solutions to the longstanding problem of a convenient and accurate clockwork that linked the optical and microwave regions and allowed for frequency comparisons between optical frequency standards with very different frequencies.
Consequently, in 2001 the Consultative Committee for Time and Frequency (CCTF) took note of the continuation of the caesium 133 definition of the second, but recognised that there were new atoms and ions being studied as potential optical frequency standards, facilitated by new optical-frequency measurement concepts that could allow the use of optical transitions as practical frequency standards offering direct microwave outputs from such standards. One of these standards could provide the basis for a future definition of the second, and the CCTF focused on the desirability of reviewing accurate frequency measurements of such atom and ion transition frequencies made relative to the caesium frequency standard. As a result, the ‘Recommendation CCTF 1 (2001)’ [17] promoted the establishment of a list of ‘secondary representations of the second’ (SRS) where the documentation of uncertainty that applied to these SRS would be the same as those for primary caesium standards used to contribute to international atomic time (TAI).
Furthermore, the establishment of the set of SRS had significant implications for the list ‘Practical realization of the definition of the metre, including recommended radiations of other optical frequency standards (2001)’, formerly the mise en pratique. In order to avoid ambiguity in respect of radiations appearing on both lists with potentially differing levels of stated uncertainty, it was considered essential that the values for mise en pratique and SRS radiations be combined in a single list, where the CCTF would ratify new and existing radiations to be accepted as SRS, and the CCL would recommend new and existing radiations for realization of the definition of the metre. Subsequently, following the wishes of the CIPM, a Joint Working Group (JWG) of the CCL/CCTF was set up in September 2003 with experts from the CCL and CCTF, taking note of convergence of interests in work, to consider the criteria for adoption of a radiation as an SRS. The JWG—later renamed as the CCL–CCTF Frequency Standards Working Group (WGFS)—recommended in 2003 that the requirements should include a peer-reviewed uncertainty budget for the frequency of the radiation, and that the total uncertainty of the value should be no more than one order of magnitude larger than the best realizations of the primary frequency standards of that date [18]. In 2004 the CCTF (in ‘Recommendation CCTF 1 (2004)’ [19]) recommended using the rubidium-87 unperturbed ground-state hyperfine quantum transition frequency (6.8 GHz) as an SRS.
As a result of these deliberations, the CIPM concluded in its ‘Recommendation CI 1 (2006)’ [20] that a common list of ‘Recommended values of standard frequencies for applications including the practical realization of the metre and secondary representations of the second’ should be established. The CIPM took into account discussions of the CCL–CCTF JWG on the ‘Mise en Pratique of the definition of the metre and the secondary representations of the second’ in meetings at the International Bureau of Weights and Measures (Bureau international des poids et mesures, BIPM) in the years 2005 and 2006 on possible candidates to be included in this list as SRS. It furthermore recommended that the four optical transition frequencies at 1065 THz (199Hg+), 688 THz (171Yb+), 444 THz (88Sr+), and 429 THz (87Sr) could be used as SRS and be included in the new list.
In 2007, the CCL recommended [21] to the CIPM an updated list of frequency values for the 12C2H2 (ν1 + v3) band at 1.54 µm, the addition of frequency values for the 12C2HD (2ν1) band at 1.54 µm, and the addition of frequency values for the hyperfine components of the P(142) 37-0, R(121) 35-0 and R(85) 33-0 iodine transitions at 532 nm, which were adopted by the CIPM as ‘Recommendation 1 (CI-2007)’ [22]. At the same meetings it was decided that an entry for unstabilized He–Ne lasers, operating on the 633 nm (3s2 → 2p4) neon transition, be included in the list of standard frequencies (‘Recommendation 2 (CI-2007)’) [23] and that an accompanying paper with CCL authority be published [24].
In 2009, the CCTF and the CCL proposed updates to certain frequency values in the CIPM LoF. Three further radiations were included in the list for the first time. These were the 88Sr transition at 429 THz, the 40Ca+ quadrupole transition at 411 THz and the 518 THz clock transition in 171Yb. These updates were recommended by the CIPM the same year [25].
Similarly, updates were recommended by the CIPM in 2013 [26] and 2015 [27] (see also [28]) following the recommendations of the CCL [29] and the CCTF [30, 31], and by the CCTF in 2017 [32].
At the 2015 update a paradigm shift became necessary as a result of two developments. Firstly, a number of optical frequency standards demonstrated smaller fractional projected uncertainties than the best caesium atomic clocks, and secondly, with the optical frequency comb technique, ratios of two optical frequencies could be measured with uncertainties that supported the uncertainties of the best optical clocks. It has been shown that the relative frequency uncertainty of the optical and microwave outputs of a femtosecond laser frequency comb can be as low as 8 × 10⁻²⁰ and 1.7 × 10⁻¹⁷, respectively [33, 34]. As a result of these developments, an increasing number of direct optical frequency ratios had been measured with uncertainties that were much lower than those of direct frequency measurements against the caesium atomic clock as the primary realization of the definition of the second. These measurements included 27Al+/199Hg+ [35], 40Ca+/87Sr [36], 171Yb+(E3)/171Yb+(E2) [37], 199Hg/87Sr [38], and 171Yb/87Sr [39]. The Al+/Hg+ frequency ratio had already been used before to determine a new recommended value for the frequency of an optical frequency standard and a SRS [26]. With the combination of direct measurements against the caesium clocks and the optical frequency ratios, the whole body of frequency data represented at that time an overdetermined set of data. Margolis and Gill [40] proposed a method to determine the best values from such a set and their method was applied for the first time for the CIPM LoF in 2015. Robertsson developed an alternative method based on a graph theory framework for closed loops [41]. The different approaches have been tested on the relevant levels to give the same results [42]. The application of the new procedure will be discussed in more detail in the next section.
In the meantime, more frequency ratios have been determined. In 2017 the CIPM decided to leave the responsibility for the recommendations to the CCTF and CCL depending on whether the particular entry is for SRS and other time and frequency applications, or for practical realizations of the metre, respectively [43]. To this end the WGFS sends proposals to the respective consultative committee (CC) which will then inform the other CC on its decision. In 2017 a new evaluation by the CCTF took place [32].
The CIPM LoF now itemised within this publication is fully up to date with the 2017 values as ratified by the CCTF and will be fully accessible from the BIPM [44] which will be the only relevant repository for all future recommended values. This repository also contains the source data file with all the entries that led to the recommendation and the information about the applied procedure.
2. List of recommended frequency standard values (CIPM LoF)
2.1. Properties of the CIPM LoF
The CIPM LoF at present already contains a large number of frequencies for different applications (figure 3). As discussed, some of those with the lowest uncertainties are used as SRS. A small group of four entries were recommended by the CCL as wavelength standards to realize the metre in interferometric length measurements (see table 1). Others find applications in current technology, e.g. in optical telecommunications [45]. Accurate frequency values are needed in basic science or the determination of fundamental constants [46]. The CIPM LoF is ordered according to frequency. The values of the frequency f and of the vacuum wavelength λ should be related exactly by the relation λ · f = c0 with c0 = 299 792 458 m s−1, but the values of λ are rounded.
Table 1. Commonly used wavelengths for the realization of the metre in dimensional metrology by interferometry.
| Frequency (THz) | Fractional uncertainty | Wavelength (nm) | Laser/absorber |
|---|---|---|---|
| 473.6127 | 1.5 × 10⁻⁶ | 632.9908 | He–Ne unstabilised |
| 473.612 353 604 | 2.1 × 10⁻¹¹ | 632.991 212 58 | He–Ne/I2 |
| 551.580 162 400 | 4.5 × 10⁻¹¹ | 543.515 663 608 | He–Ne/I2 |
| 563.260 223 513 | 8.9 × 10⁻¹² | 532 245 036.104 | 2 f (Nd:YAG)/I2 |
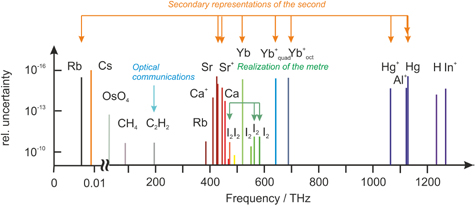
Figure 3. Graphical summary of the recommended frequency standard values (as of 2017) and their specific use for optical communications, for the realization of the metre, or for SRS.
Download figure:
Standard image High-resolution imageFollowing a decision by the CIPM, the CIPM LoF is conceptually divided into two parts. The first part (‘active list’) includes radiations of high accuracy that are of use in the realization of optical frequencies and vacuum wavelengths. The second part of the list (‘frozen list’) includes radiations that are still deemed useful for various applications but may have larger uncertainties and which will in general have no future updates of their value. The webpage of the BIPM currently does not discriminate between standard frequency values belonging to the first or the second part of the CIPM LoF.
Each of the listed radiations can be replaced, without degrading the accuracy, by a radiation corresponding to another component of the same transition or by another radiation, when the frequency difference is known with sufficient accuracy. In some cases, e.g. iodine stabilized lasers or acetylene stabilized lasers, such frequency intervals between transitions and hyperfine components have been validated and recommended by the CIPM also. They are also given in the source data files [44].
Many of the recommended radiations refer to the frequency of the unperturbed transition. When using these recommended frequencies it is left to the user to ensure the necessary corrections for their particular cases are applied. Some of the recommended radiations of stabilized lasers on this list specify the use of specific laser technology i.e. ‘HeNe/I2 at 473 THz’ or specific operational conditions such as the intracavity power or the pressure in the absorption cell. Other laser technology may be used providing that the realization is calibrated by method (b).
One issue arising in respect of the future evolution of the CIPM LoF is the identification of criteria for inclusion of frequency values within the list. Given the powerful capability of femtosecond combs to compare optical frequencies at the 10−20 level, there is potentially a wide range of atomic reference transitions that could be included. However, it is not considered desirable to proliferate the number of different entries within the list, and one general consideration is to examine the nature, usefulness and application of a prospective addition with respect to its metrological application. Thus, criteria might include the achieved level of uncertainty relative to the intended application. Relevant metrological applications include those in time and frequency, length and dimensional metrology, optical communication standards and applications in science and fundamental constants.
Furthermore, when some radiations already included in the list are considered unlikely to find any metrological application going forward, the precedent has already been established for the radiation to be moved from the ‘active’ list, to the ‘frozen’ list. It is anticipated that no further update in the frequency values within this ‘frozen’ list will be warranted, either on account of their relatively high uncertainty or their lack of application. However, it remains perfectly acceptable to make use of these values for specific applications where no user alternative is readily available, such as the use of spectral lamps for gauge block calibration within industry, or where the accuracy required is sufficiently low, such as those applications where the use of an unstabilised 633 nm He–Ne laser is appropriate.
Additionally, it remains open to the WGFS to recommend, after careful deliberation, deletion from the list in certain cases where no purpose continues to be served by that radiation.
2.2. Frequency standards commonly used for the realization of the definition of the metre by interferometry
The former list of recommended radiations originally contained five radiations of lasers stabilized to molecular absorption lines together with radiations of spectral lamps [2]. Subsequently, the number of radiations in this list increased and many of them were never used for practical length measurements (even if they could have been). When the CIPM LoF was established in 2005, the ‘Recommendation CCL2 (2005)’ [47] proposed ‘that the CCL may wish to select those frequencies which it considers important to highlight for use in high accuracy length metrology’. At the WGFS meeting on the 10–11 September 2007 the wavelengths at 633 nm, 543 nm and 532 nm were at this stage chosen as commonly used wavelengths (see table 1) but the meeting agreed to seek advice from the Working Group on Dimensional Metrology (WGDM) on this selection5.
In 2007, following a proposition from the CCL (‘CCL13 (2007)’ [49]) the CIPM recommended the unstabilised He–Ne laser at 633 nm for use in dimensional metrology. A more detailed guide relating to the use of 633 nm unstabilised lasers has been published subsequently [24].
In 2015 the CIPM—at the request of the CCL [50]—adopted the updates to the CIPM LoF [51], to include the 87Rb d/f crossover saturated absorption D2 line at 780 nm [52, 53] and the 531.5 nm saturated absorption a1 transition in molecular 127I2.
A recent detailed review about the transfer of the SI unit metre from the definition to practical length metrology can be found in [54].
2.3. Frequency standards recommended as SRS
As can be seen from figure 2 the estimated uncertainties obtained in realizing the unperturbed line centre of a transition are much lower for various atoms than the uncertainty that can be realized by the best atomic clocks based on the caesium hyperfine ground state. The lowest estimated uncertainties in the 10−18 range have been reported for the 87Sr optical lattice clock [55, 56], the 171Yb+ single-ion clock [57] or the 27Al+ quantum logic clock [58].
One has to discriminate carefully between these estimated uncertainties to realize the true line centre of the unperturbed transition and known frequencies in the SI. In the CIPM LoF following the recommendation of the CCTF in 2017, there are now one microwave transition (hyperfine transition in 87Rb) and eight optical frequency standards that are recommended as SRS (table 2) with estimated uncertainties as low as 4 × 10⁻¹⁶. This uncertainty is only a factor of about two larger than the uncertainties of the best primary caesium atomic clocks. In recent years, the 87Rb fountain clock at LNE-SYRTE has regularly contributed to TAI as can be seen from the time bulletin ‘Circular T’ [59] and from [60]. It has been shown that TAI could benefit well from optical clocks [61–63]. First attempts have also been made to include 87Sr optical lattice clocks.
Table 2. SRS as of 2017.
| Frequency (Hz) | Fractional uncertainty | Transition |
|---|---|---|
| 6834 682 610.904 3126 | 6 × 10⁻¹⁶ | 87Rb ground state hfs |
| 429 228 004 229 873.0 | 4 × 10⁻¹⁶ | 87Sr neutral atom, |
| 5s2 1S0–5s5p 3P0 | ||
| 444 779 044 095 486.5 | 1.5 × 10⁻¹⁵ | 88Sr+ ion, |
| 5s 2S1/2–4d 2D5/2 | ||
| 518 295 836 590 863.6 | 5 × 10⁻¹⁶ | 171Yb neutral atom, |
| 6s2 1S0–6s6p 3P0 | ||
| 642 121 496 772 645.0 | 6 × 10⁻¹⁶ | 171Yb+ ion, |
| 2S1/2–2F7/2 | ||
| 688 358 979 309 308.3 | 6 × 10⁻¹⁶ | 171Yb+ ion, |
| 6s 2S1/2–5d 2D3/2 | ||
| 1064 721 609 899 145.3 | 1.9 × 10⁻¹⁵ | 199Hg+ ion, |
| 5d106s 2S1/2–5d96s2 2D5/2 | ||
| 1121 015 393 207 857.3 | 1.9 × 10⁻¹⁵ | 27Al+ ion, |
| 3s2 1S0–3s3p 3P0 | ||
| 1128 575 290 808 154.4 | 5 × 10⁻¹⁶ | 199Hg neutral atom, |
| 6s2 1S0–6s6p 3P0 |
3. Guidelines for inclusion in the CIPM LoF and statement of associated uncertainty
Given the substantial rate of progress in frequency metrology and the rapid output of new measured frequency values made possible by femtosecond frequency combs, the WGFS has developed criteria and procedures for the inclusion of a new or updated frequency value in the CIPM LoF. These are, to a large extent, based on analysis from the previous CCL–CCTF JWG and CCL MePWG, but also incorporate criteria already adopted for the inclusion of primary frequency standards in TAI [64] in the case of those radiations under consideration as SRS.
For each new evaluation—typically at intervals dictated by the official meetings of the CCL and of the CCTF—the WGFS summarizes the development and measurements all over the world to be used either for considering updates of already recommended frequencies, or possibly to be introduced as new recommended frequencies. For any such value to be included, the WGFS considers only the data that have been published in peer-reviewed, international, scientific journals. It then makes a thorough assessment of the value, and estimates an uncertainty, in which the uncertainty published in that journal is an important, but not the only, contribution. The WGFS applies a Bayesian approach to make use of all available information to estimate the uncertainty of each recommendation. Such additional information can result from a variety of sources. A few examples can illustrate this. Sometimes, authors apply corrections to their measurements, e.g. based on the measurement of others or on theoretical data without uncertainties. The working group considers these data and sometimes feels the need to increase these partial uncertainties which will affect the total uncertainty. Sometimes, authors reference their values to particular environmental conditions, e.g. at room temperature. In this case corrections have to be applied to relate the measured frequency to an environment free of perturbations, which can subsequently increase the former stated uncertainty. The use of the same theoretical or experimental sensitivity coefficient for an applied correction to the measurements of different origin leads to a correlation effect which tends to reduce the uncertainty if not correctly taken into account. Only a few institutes have at their disposal primary caesium atomic clocks that can realize the second with an uncertainty in the low 10−16 regime. Others rely for their measurement on the SI second as provided by the international atomic time scale Coordinated Universal Time (UTC) or TAI, to which the institutes with Cs fountains contribute, and which is also a source of correlations. Furthermore, additional information is sometimes obtained only after publication of the frequency values, which can then affect the published uncertainties.
In several cases, for a particular radiation, very few frequency values—or even just one value—may be under consideration. Here one could make some statistical assumptions and give a formal estimation, but since only a small amount of information is available in a single measurement this leads most certainly to a low predictability. However, it has been shown that an alternative approach that combines the Working Group expertise, together with empirical rules for the estimation of this uncertainty, has indeed led to consistent values. This approach uses for the first values an enlargement factor to derive a global uncertainty which takes account of the values available, given the insufficient state of knowledge associated with the very small data set, different qualities of the contributions, and potential hidden dependencies. Such an enlarged preliminary uncertainty also indicates that there are likely to be factors influencing the frequency that are not covered in the same complete way in the initial phase of a new standard compared to later phases. With time, an experiment matures and the confidence in its operation increases, which ought to lead to a better and more precise uncertainty estimation as well as the possibility of identifying those components that best improve the experiment. This procedure therefore seems to be an adequate method of operation until new and improved understanding becomes available.
The criteria can be summarized as:
- (i)The primary requirement for inclusion in the CIPM LoF is the existence of a peer-reviewed publication (or at least an official acceptance for publication by the journal) at the time of consideration. This pre-supposes the suitability of the radiation for frequency, length and other precision metrology as determined by the WGFS.
- (ii)When only one frequency value is available from a single laboratory, the estimated standard uncertainty adopted is typically a factor of three larger than the uncertainty quoted in the published paper. Depending on the information available to the WGFS at the time concerning measurement data and conditions, the WGFS may consider it appropriate to expand the uncertainty by a further factor, or round the final result.
- (iii)When two values are available (e.g. from a single laboratory at different times, or from two laboratories), the frequency value adopted is the mean value weighted by the respective published uncertainties. These uncertainties are combined in quadrature, and then a factor of two to three is applied to this combined value to give the estimated standard uncertainty for the CIPM LoF. In this way, more reliance is placed on the value with lower uncertainty.
- (iv)For frequencies with three or more data values submitted, the value adopted is the weighted mean. For situations where the values have individual uncertainties which are of a similar magnitude (e.g. all within a factor of five), the situation is such that statistical analysis can be applied, but with some recognition that this may still not be a fully robust procedure.
These rules have been applied over the last two decades for individual frequency values derived from a direct comparison with the caesium atomic clock. With the availability of high accuracy direct frequency ratios between (mostly optical) frequency standards, the above stated rules were amended:
- (v)For frequencies linked to other frequencies in the CIPM LoF by direct or indirect frequency comparisons with sufficiently low uncertainty, the recommended frequency value results from a least squares analysis of the relevant data. The uncertainties include the estimated correlations between the different measurements. Rules (ii)–(iv) are applied accordingly to single measurements of frequency ratios.
This procedure helps to cope with different aims, such as the consistency of the frequency scale and the derivation of realistic uncertainties that can be used in the commonly accepted framework of the guide to the expression of uncertainty in measurement (GUM) [65]. The global uncertainty derived for the listed radiations needs to be estimated to ensure consistency with future values and potentially tighter uncertainties, and to avoid discrete steps in frequency value of a magnitude larger than the combined uncertainties of previous and future values. This is also important to ensure that discontinuities in the SI second are avoided if the new data is, for example, incorporated into a new definition of the second. Furthermore, the uncertainty of the recommended frequency will often be used as one input data point for an uncertainty budget with several other input data. Following the GUM [65] all independent contributions will be added in quadrature, tacitly assuming that the probability density of the particular contribution is Gaussian. This is only justified if the central limit theorem applies to a good approximation, which is definitely not the case if there are only one or two entries. In such a case the connection between the standard uncertainty with expansion factor k = 1, k = 2 and k = 3 and the confidence interval 68.27%, 95.45% and 99.73%, respectively, for an infinite number of measurements (degrees of freedom) completely breaks down. For one degree of freedom, the more appropriate Student’s t-distribution6 shows that the interval that encompasses a fraction of 68.27%, 95.45% and 99.73% of the distribution would have to be enlarged by a factor of 1.84, ~7 and ~78, respectively, as compared to the Gaussian distribution. By using the term ‘estimated standard uncertainty’, in general one thinks of 68% coverage. Here, the Student corrections for one or two measurements already make up a considerable fraction of the factors 2–3 applied by the WGFS.
Looking at the actual coverage in hindsight, if about every third value is actually outside these limits, this could give a hint about the validity of the adopted interpretation of the initial recommended value. Even though the data base of the CIPM LoF is still very small for such an investigation, in several cases our current best frequency estimate based on more measurements is very close to such a confidence limit of the first recommendation. Examples include 115In+ and 88Sr. This observation lends support to the interpretation that the uncertainty of the recommended frequency values at these early stages can also be regarded as the typical estimated standard uncertainties.
It is interesting to compare this procedure with that of the Committee on Data of the International Council for Science (CODATA) [66]. ‘This group calculates the weighted mean and uncertainty for measurements from several laboratories and normally takes a simple weighted mean and weighted uncertainty and then checks the chi-squared. If the data set is not consistent with the calculated distribution, the practice is to multiply the variances of all the measurements by the same multiplier (in some cases this has been as large as 15) and again take a simple weighted mean and weighted uncertainty. Again, the chi-squared is calculated to ensure that the calculated mean and uncertainty are consistent with the measurements. In contrast to the procedure of the WGFS, the CODATA group does not multiply the variances of only one or some of the measured values. The variances of all the measurements are all multiplied by the same value. If one measurement dominates over the others and is consistent with the others, then no multiplication is performed before taking the weighted mean’ [67].
3.1. Examples
3.1.1. Iodine stabilized laser at 474 THz.
The iodine stabilized laser at 474 THz has for a long time been the most prominent laser standard for the realization of the metre. Extensive intercomparisons with the lasers maintained at the BIPM allowed the CIPM to reduce the estimated standard uncertainty from 3.4 × 10⁻¹⁰ (1984) to 2.5 × 10⁻¹¹ (1992) and 2.1 × 10⁻¹¹ (2003). Comparisons with the laser BIPM4, which essentially served as a practical realization of the metre, showed that the mean of all lasers in the different National Metrology Institutes agreed with their frequencies within about 2.5 kHz [68, 69]. In 2003 [70] the absolute frequency was directly measured for BIPM4 and found to be 473 612 335 605.4 kHz with a combined uncertainty of 1.8 kHz. This is a value in close agreement with the value adopted for this radiation in the list of recommended radiations for the realization of the metre, further attesting the successful implementation of the metre up to that date. Nevertheless the recommended uncertainty was kept at 10 kHz since most of the lasers used the same design and optical set-up (which was not specified in the recommendation) and where other configurations seemed to have a larger influence on the stabilized frequency. The formal work of validation and implementation of the metre is today organized under the CCL key comparison CCL–K11 based on frequency comb techniques, and is reported to the WGFS.
3.1.2. 87Sr lattice clock (SRS).
As a second example we analyse the measurement and recommendations of the SRS 87Sr lattice clock transition at 429 THz (figure 4). A large number of measurements of the frequency of the Sr lattice clock have so far been performed and published [61, 62, 71–91]. In 2006 the WGFS used measurements [73–75] from three independent laboratories to devise a recommendation, but did not consider the earlier values [71, 72] that were not consistent with later ones. After approval by the CCTF and CCL, the CIPM in 2006 recommended the frequency 429 228 004 229 877 Hz with an estimated fractional uncertainty of 1.5 × 10⁻¹⁴, equivalent to 6.4 Hz. This frequency value and the assigned uncertainty are shown in figure 4 in the left section by the purple horizontal bar and pink area, respectively. At the meeting of the WGFS in 2009, four new frequency measurements were available [76–79]. Two of them came from the same laboratory (JILA [76, 78]) with the second one having a threefold reduced uncertainty. Hence, only the latter one was included, together with the two values from France and Japan [77, 79], to derive the weighted mean of 429 228 004 229 873.7 Hz with a fractional uncertainty of 1 × 10⁻¹⁵ which was subsequently recommended by the CIPM [25]. This low uncertainty allowed the CIPM to recommend the Sr lattice clock transition as an SRS. Two new measurements [80, 81] were performed for the next evaluation in 2012 and a weighted mean of these five values sees the frequency value reduced by 0.3 Hz. The fractional uncertainty was kept at 1 × 10⁻¹⁵ since the later measurements seemed to have a slightly lower value compared to the earlier ones. The new value was recommended by the CIPM in 2013 [26].

Figure 4. Frequency measurements of the unperturbed 87Sr transition in an optical lattice (points) and associated uncertainties for N measurements together with the frequency values (purple bars) recommended by the CIPM and the associated uncertainty bands (pink bands). N = 1: [73]; N = 2: [74]; N = 3: [75]; N = 4: [76]; N = 5: [77]; N = 6: [78]; N = 7: [79]; N = 8: [80]; N = 9: [81]; N = 10: [61]; N = 11: [82]; N = 12: [84]; N = 13: [85]; N = 14: [87]; N = 15: [88]; N = 16: [62]; N = 17: [62]; N = 18: [89]; N = 19: [90]. See text.
Download figure:
Standard image High-resolution imageFor the 2015 evaluation there were seven new measurements available [61, 82–87]. Together with the previous measurements, the new measurements (except for one) were used to derive a new recommendation based on a weighted mean. The measurement of Hachisu et al [86] was omitted because it was essentially based on the measurement of Falke et al [84]. In this evaluation the first optical frequency ratio measurements were also introduced, in the way described in more detail below. Frequency ratios connected the 87Sr value with the values of the 171Yb and the 199Hg transitions in lattice clocks and in the 40Ca+ single-ion clock. Due to the large number of low uncertainty 87Sr data the inclusion of these frequency ratios did not have much influence on the 87Sr value itself, but were extremely helpful in tying down the uncertainties of other frequencies linked with the 87Sr values by the measured ratios.
The latest evaluation results from 2017 included five more direct frequency measurements with respect to the caesium clocks, and frequency ratio measurements with respect to other optical and microwave standards. The last two measurements (number 18 and 19) did not use a local primary frequency standard but were related to TAI. All the new measurements with low uncertainty were slightly below the recommendation of 2015. The outcome of the latest adjustment—to be discussed in more detail below—used all 19 values displayed in figure 4. As a result, the recommended frequency was reduced by 0.2 Hz and the fractional uncertainty was reduced to 4 × 10⁻¹⁶. This uncertainty is not much higher than the relative uncertainty in realizing the SI Hz with the best primary caesium fountains. The estimated uncertainty was based on the comparison, via a fibre link, between primary standards [91] which included the uncertainties of the primary standards as well as the contribution of the fibre link.
4. Inclusion of optical frequency ratios
As pointed out above, the inclusion of optical frequency ratios and optical-to-microwave ratios has changed the evaluation procedure substantially. Besides a number of direct frequency measurements compared directly against the caesium atomic clock, there are a number of optical frequency ratios between optical atomic clocks that have been determined (figure 4) with much smaller uncertainties than would be possible if caesium clocks or other microwave clocks were involved. They include 27Al+/199Hg+ [58], 40Ca+/87Sr [36], 171Yb+(E3)/171Yb+(E2) [37], 199Hg/87Sr [38], 171Yb/87Sr [92] or 199Hg/87Rb [93]. Such frequency ratios have already been used to determine new recommended values for the frequencies of optical frequency standards and SRS [27]. Together with the direct absolute frequency measurements with respect to the caesium clocks, these frequency ratio measurements form an overdetermined set of data. It can be foreseen that optical frequency ratio measurements will involve an increasing number of the frequency standards (figure 5) and may also include new ones.
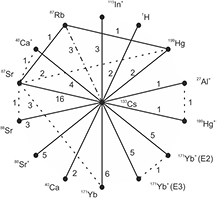
Figure 5. Measured frequency ratios between the 133Cs primary standard and the Rb microwave standard (dashed–dotted line), microwave standards (133Cs and 87Rb) and optical standards (full lines) and direct optical frequency ratios (dashed lines) as used in the 2017 evaluation. The picture is simplified in the sense that there is no single Cs clock and no single other standard but in reality there are many different realizations of the Cs second or other standards used for the particular frequency measurements. The numbers at the lines indicate the numbers of independent measurements.
Download figure:
Standard image High-resolution imageMargolis and Gill proposed and applied a least squares method to determine the ‘best’ estimates of the frequency values [40] from such a set of overdetermined measurements. All validated frequency measurements and frequency ratio measurements are prepared as frequency ratios with the direct frequency measurements against the caesium primary standard also expressed in frequency ratios. The fact that the input data set consists of frequency ratios makes this a non-linear least squares problem requiring linearization and iterations to find an acceptable solution. The adjusted frequency values can be used to determine other frequencies if the frequency ratio is to be measured later. Independent programmes are available and have been used to validate the codes. One of those devised by Robertsson [41] uses a slightly different conceptual approach which is based on the examination of closed loops in a graph theory framework [94]. Such closed loops can be easily recognized in figure 5, e.g. by the three-node single loop comprising 171Yb+(E2), 171Yb+(E3), 133Cs or the four-node loop comprising 171Yb, 87Sr, 199Hg, 133Cs. To circumvent the non-linearity of the ratios the logarithms of the frequencies are used, leading to a linear least squares problem. Similar to a three-cornered hat analysis, the logarithms of all frequency ratios should add up to zero. This provides a set of conditions which in a Lagrange multiplier scheme helps to identify the basis vectors for the residual space in the least squares calculation. A projection on this subspace gives the corrections in the experimental ratio values.
These methods for using all available experimental frequency data with their proper weights lead to a system of adjusted values that are more robust against outliers as compared to isolated frequency ratios. With the two methods discussed above, such outliers can even be identified, as has been demonstrated in [40]. If such outliers are not identified, the whole system of recommended frequencies can be affected by an erroneous frequency ratio measurement with underestimated uncertainty. In the same way, correlations between single measurements, if not properly identified, can have similar effects. Consider the case of two frequency measurements of, for example, 171Yb+(E2), 171Yb+(E3) in figure 5 performed at the same time against the same Cs clock. Any increase in the Cs frequency will immediately lead to a correlated reduction of the uncertainties of both frequency ratios 171Yb+(E2)/133Cs and 171Yb+(E3)/133Cs. Unidentified correlations would consequently overestimate the weight of these two particular measurements in the system of frequencies. Thus the WGFS tries to estimate such correlations quantitatively. The GUM gives rules to calculate or estimate the correlation coefficients whose square is used in the two methods given above for the correlation matrix.
There might, however, be less-controllable sources of correlations that are harder to quantify. It has been shown recently that the SI-traceable measurement of an optical frequency can be performed at the low 10−16 level without a local primary standard, but referenced to TAI [90]. In this case any frequency ratio measurement against a local caesium clock that contributes to TAI during such a measurement will show residual correlations with any other optical frequency standard that is measured against TAI. For the time being, such a correlation will be significantly reduced by the averaging process used to generate TAI but will become more prominent if two optical standards are directly measured against TAI at the same time. It will become even more pronounced if optical clock networks [95] for optical frequency ratios are employed as a matter of course. This suggests that additional rules for reporting both frequency measurements and frequency ratio measurements are needed where, for example, the links and the full data of the measurement period (including the start and end times, the time of day (UTC) and the calendar day, together with the relevant interruptions) are stated. The WGFS is developing reporting guidelines that aim to take correlation effects into account more fully.
Recent deliberations by the CCL–CCTF WGFS have also considered the potential for inclusion of high accuracy frequency ratios within an additional appendix to the CIPM LoF. Whilst any optical–Cs microwave frequency ratio necessarily includes the uncertainty associated with the primary Cs frequency value, direct optical–optical frequency ratios of, for example, SRS are capable of much lower uncertainty due to their better reproducibility than the Cs standard and the capability of comb measurements at uncertainty levels even below the optical reproducibilities. Such a procedure, however, has not yet been decided.
5. Towards a new definition of the SI second
It was obvious for a long time that a much lower inherent uncertainty, and a much higher relative stability, of the clock frequency could be realized with clocks operating on an optical transition rather than a microwave transition. The process initiated in 2001 led to the establishment of SRS in order to investigate their suitability for a future redefinition of the SI second and to utilize them in the realization of TAI with the prospect of improved time scales. Fifteen years later, nine SRS are available (87Rb as a microwave standard and eight optical SRS). The 87Rb standard and the Sr lattice clock at SYRTE are beginning to contribute regularly to TAI and it has been shown that a time scale can be established based on an optical clock that is superior to one based on even the best caesium fountain clocks [61–63]. By introducing more of the SRS and possibly replacing less accurate clocks like hydrogen masers or caesium beam clocks at the same time, the SRS could gradually begin to improve the TAI and UTC time scales.
In the meantime, optical atomic clocks, optical long haul links and the various methods of all-optical frequency metrology are finding widespread applications and have even led to the creation of novel fields like relativistic geodesy [96, 97]. It is well known that according to General Relativity two optical clocks in a different gravitational potential show different frequencies [98] when compared, and this effect has been taken into account for a long time when comparing microwave atomic clocks in the international time scales TAI and UTC. But with the achieved accuracy and stability of optical atomic clocks it becomes possible to use this effect to determine the difference in the gravitational potential of two locations on Earth. In time and frequency metrology, apart from the creation of better time scales, the distribution of highly accurate and extremely stable optical frequencies via fibres to many customers [99] may lead to new services or allow synchronization of clocks over large distances. For tests of fundamental theories or the question of the constancy of fundamental constants [37, 100], optical atomic clocks are the measuring devices of choice to grasp the first hints of new physics. In space technology and astronomy, the ultra-precise tracking of spacecraft and the improved reference systems for very long baseline interferometry, respectively, will benefit from the optical clocks. Thus, there is a growing community that will benefit from a redefinition of the second in terms of an optical clock transition, and so the questions of when the time is right to redefine the unit of time, what the necessary requirements are, and possible time scales for such a process are becoming increasingly relevant and urgent [101–103]. The Working Group of Strategic Planning (WGSP) of the CCTF has thus devised a roadmap to accompany this process, which is outlined in the following section.
5.1. Milestones on a roadmap towards a redefinition of the second
From figure 2, one expects that the uncertainties of optical frequency standards will continue to reduce over the coming years. The recent developments in novel excitation schemes [104–106], 3D confinement of quantum absorbers [107], and new strategies for the reduction of systematic shifts [108] lend promise to this expectation that fractional uncertainties below 10−18 could be reached. However, limited knowledge about the exact gravitational potential suggests difficulties in the use of practical time scales at this level on Earth. With fractional inaccuracies in the 10−18 regime, the geopotential has to be determined to the cm-level to account for gravitational redshift. From this point of view, the time would be right for a new definition when the optical clocks have furnished proof that their typical performances reach fractional uncertainties of around 10−18, which would be roughly two orders of magnitude lower than that expected of the best caesium fountains of the time.
There are several ways to properly verify when such a hundredfold improvement in the potential accuracy of optical clocks over caesium primary clocks has been achieved. Optical clocks of the same type, e.g. the Sr lattice clocks at SYRTE, NPL and PTB can be compared with such an uncertainty in the different laboratories linked via already-established fibre links [95, 103, 109]. Frequency comparisons between remote clocks can also be performed using transportable optical atomic clocks [110, 111]. A third option for such a comparison can be based on different measured frequency ratios and the associated evaluations between remote optical clocks in the way suggested below.
From these considerations, one could define the first two milestones to be reached before a new definition can take place. The time for a new definition is right when
- 1.at least three different optical clocks (either in different laboratories, or of different species) have demonstrated validated uncertainties of about two orders of magnitude better than the best Cs atomic clocks of the time.
- 2.at least three independent measurements of at least one optical clock from milestone 1 have been compared in different institutes (with, e.g., Δν/ν < 5 × 10⁻¹⁸) either by transportable clocks, advanced links, or frequency ratio closures.
To assure continuity between the present definition and the new definition, the frequency of the selected optical clock has to be measured with respect to the best caesium fountain atomic clocks with uncertainties essentially determined by the fountain clocks. Thus, the time for a new definition is right when
- 3.three independent measurements of the optical frequency standards of milestone 1 with three independent Cs primary clocks have been performed, where the measurements are limited essentially by the uncertainty of these Cs fountain clocks (with, e.g., Δν/ν < 3 × 10⁻¹⁶).
It is highly desirable that optical clocks that have been assigned the status of SRS contribute regularly to TAI in order to improve the time scale and to further develop the technology and protocols of improved methods for comparisons. This requires another milestone. The time for a new definition is right when
- 4.optical clocks (SRS) contribute regularly to TAI.
To allow for closures and links between the dozen or more different optical standards and their continuous use, a fifth milestone would thus be desirable. The time for a new definition is right when
- 5.optical frequency ratios between a few (at least 5) other optical frequency standards have been performed; each ratio measured at least twice by independent laboratories and agreement was found to better than, e.g., Δν/ν 5 × 10⁻¹⁸.
It remains within the authority of the CIPM as to when it will make a proposition to the CGPM for a redefinition. From the current status it can be estimated that the new definition could come into effect before 2030. After a redefinition, the present standard of time and frequency would serve as an SRS where the uncertainty to realize the second would be the same as before. Improvements in the caesium atomic clocks would then be evaluated regularly within the established framework of a caesium clock as an SRS.
It should be noted that a number of the national metrology institutes will have the ability to link a chosen species for a new optical definition of the second to other optical clock species accepted as SRS, by means of femtosecond comb and optical fibre transfer techniques, without an increase in the combined uncertainties above the level of a few times 10−18. In this case, one would be able to realize the new definition by means of these SRS with very little increase in uncertainty.
6. Conclusion
Optical frequency standards, first used as vacuum wavelength standards for the realization of the metre in length metrology, have evolved into optical clocks that now find their most prominent application in frequency metrology. The clear demand in these and other fields, with novel and unforeseen applications, has led to a single list of recommended frequency standard values for applications including the practical realization of the metre and SRS. These frequency values and their uncertainties have been determined with coherent procedures as described in this publication. Even though the rapid progress in optical frequencies has been less beneficial for dimensional length measurements under ambient conditions, i.e. where the index of refraction matters, length measurements in space will also benefit from the new technologies and platforms that use optical frequencies. The newly-established analyses and procedures for deriving a coherent list of recommended frequencies from an overdetermined set of measurements are leading to a transparent and robust system of high reliability and low uncertainty. It is, furthermore, a solid basis that can lead to a future new definition of the SI unit of time, the second.
Acknowledgments
Extremely helpful discussions with the members of the CCTF WGFS, the CCTF WGSP and particular members of the CCL are gratefully acknowledged.


