- Create Infographics
Free infographic maker

Easy drag-and-drop editor
1M+ professionally-designed templates
Generate content and media with AI
Invite others and design together
Make an infographic in minutes, not months, with Canva’s easy-to-use infographic creator.

Create compelling infographics, fast
Make data beautiful—and easy to digest. With Canva’s free infographics maker, there’s no need to struggle with complicated design software. Simply choose an infographic template, add your information and there you have it: A stunning custom infographic.
Canva has an extensive range of templates and thousands of illustrations—meaning whatever your subject matter, you can bring it to life with our free and easy infographic creator.
How to make an infographic

Meet Magic Studio™: All the power of Canva’s AI
Magic Studio™ brings together the best AI-powered tools for you and your team to help you design with more ease, speed, and creativity.


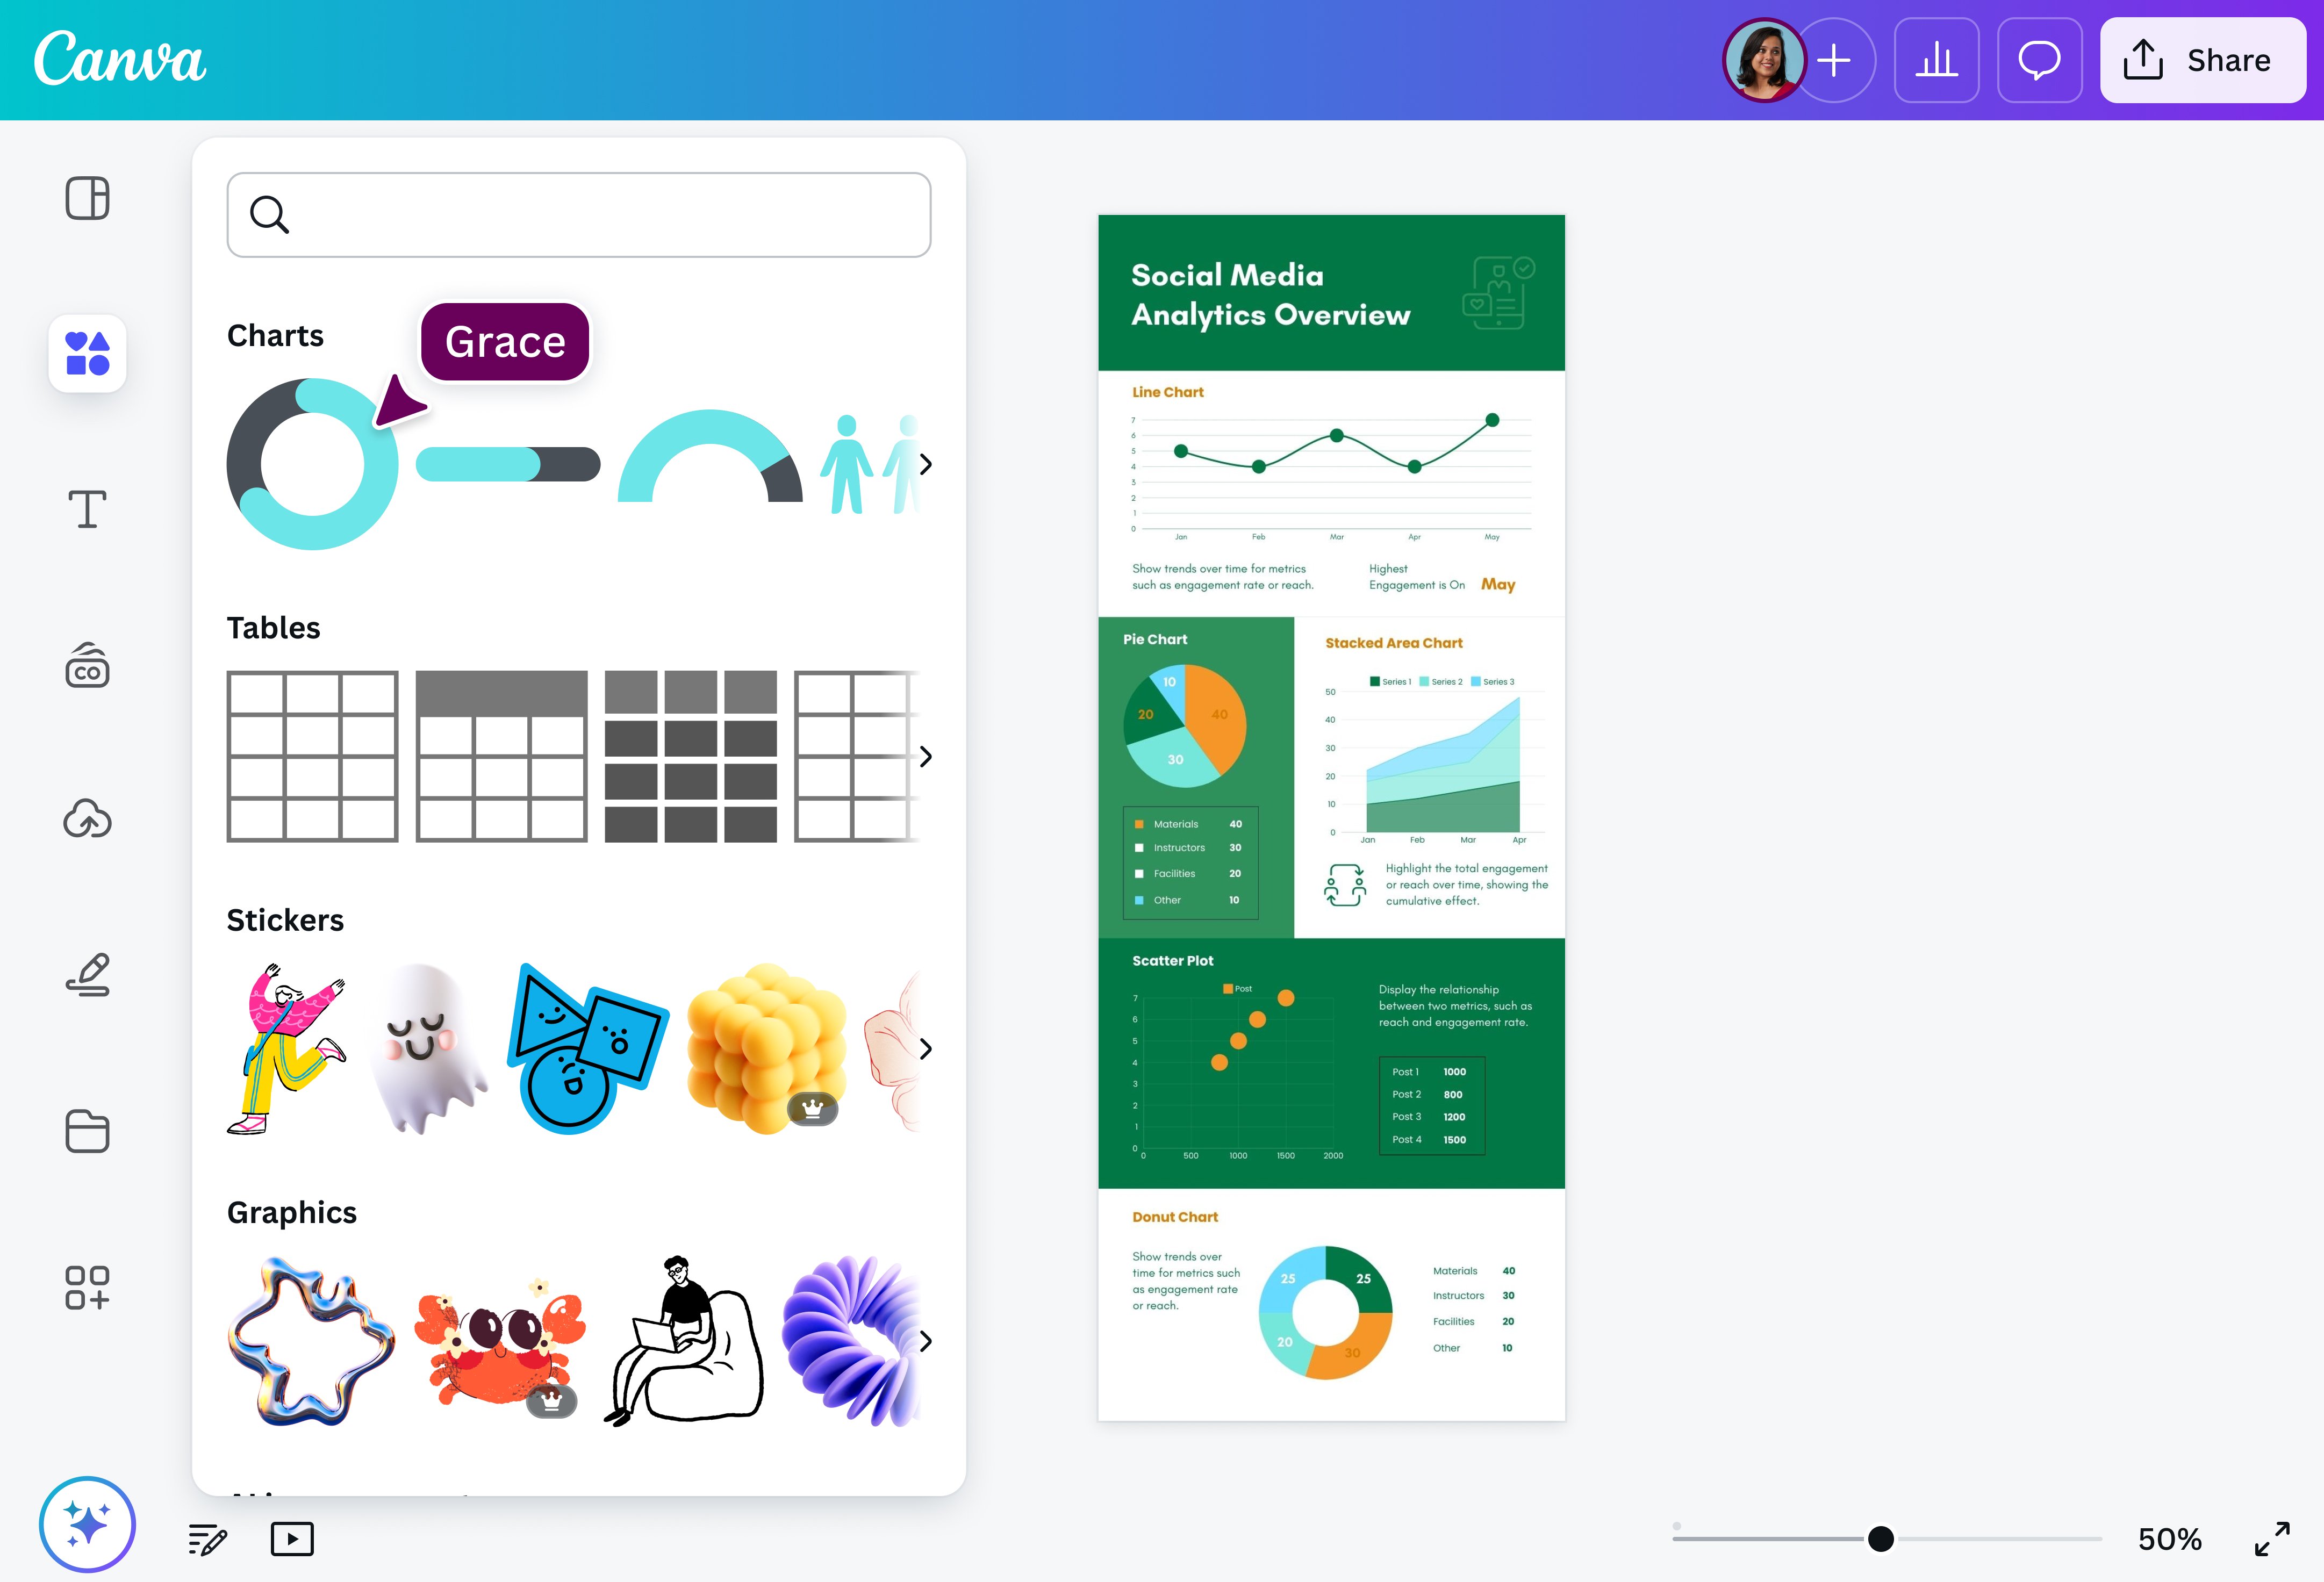
Make data beautiful with stunning charts
Facts and figures don’t need to be dull. With Canva’s Charts tool, you can add all the hard data you like, and keep the eye-catching look of your infographic.
With customizable colors and various styles including bar charts, line graphs, pictograms(opens in a new tab or window) and stylish pie charts, you can forget about old-school graphs—these charts are a work of art.
Put the ‘graphic’ into infographics
Canva is jam-packed with all of the images you need to turn dry facts into stunning graphics. Our library has over 2 million photos, icons and illustrations, with thousands of free images and premium images at a very competitive price.
Got some spectacular graphics of your own? Upload them in seconds and add them to your infographic or use our PDF to PNG converter(opens in a new tab or window) to extract your existing images.
Collaborate with ease
Some of the best design ideas come when we work together. With Canva you can create a team and collaborate on your infographic design in real-time. Play with colors, add graphics, translate(opens in a new tab or window), leave comments, and resolve suggestions all within the Canva editor. To create a team simply add the email address of your friends, family, classmates, or colleagues and start designing in no time.
Infographics for every need
Whether you’re creating your infographic for a presentation, marketing creative brief(opens in a new tab or window)ormarketing materials, or a school assignment, Canva’s infographic creator has you covered. Our templates are a versatile way to get the look you want, fast—or you can design from scratch with our easy drag-and-drop tools.
And you can bring the whole team on board! Our infographic maker is designed for collaboration.
FAQ
An effective infographic includes:
- High quality graphics
- Current and relevant data
- Good organization
- A balance of text and illustration
Pay attention to visual style and flow, use a typography palette with a hierarchy, include plenty of space and add a call-to-action.
A good infographic is clear, memorable and visually and textually concise. Data visualization is the main goal, so use charts and graphs where you can. Tell a story with your graphics and include a “hook,” or primary take-away, that’s easy to spot.
The size of your infographic will depend on the platform you’re using it for. For blog posts, infographics should be around 663 x 2000 pixels. For a Facebook post, aim for 1200 x 628 pixels. For a shared image on LinkedIn, go for 1104 x 736.

Thomas A.


