
Maps
A Map of the Online World in Incredible Detail
View the giant full-size (20 MB) version of this map.
A Map of the Online World in Incredible Detail
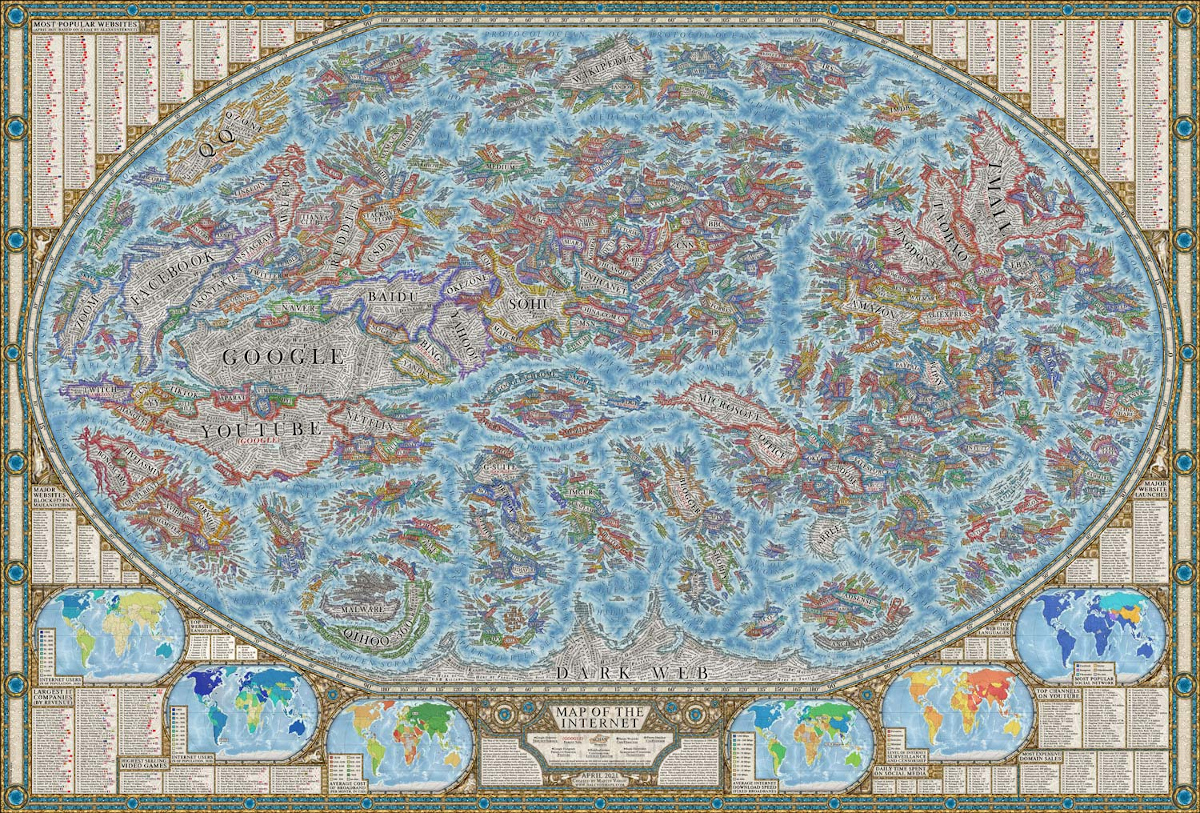
The internet is intangible, and because you can’t see it, it can be hard to comprehend its sheer vastness. As well, it’s difficult to gauge the relative size of different web properties. However, this map of the internet by Halcyon Maps offers a unique solution to these problems.
Inspired by the look and design of historical maps, this graphic provides a snapshot of the current state of the World Wide Web, as of April 2021. Let’s take a closer look!
But First, Methodology
Before diving into an analysis, it’s worth touching on the methodology behind this graphic’s design.
This map highlights thousands of the world’s most popular websites by visualizing them as “countries.” These “countries” are organized into clusters that are grouped by their content type (whether it’s a news website, search engine, e-commerce platform, etc).
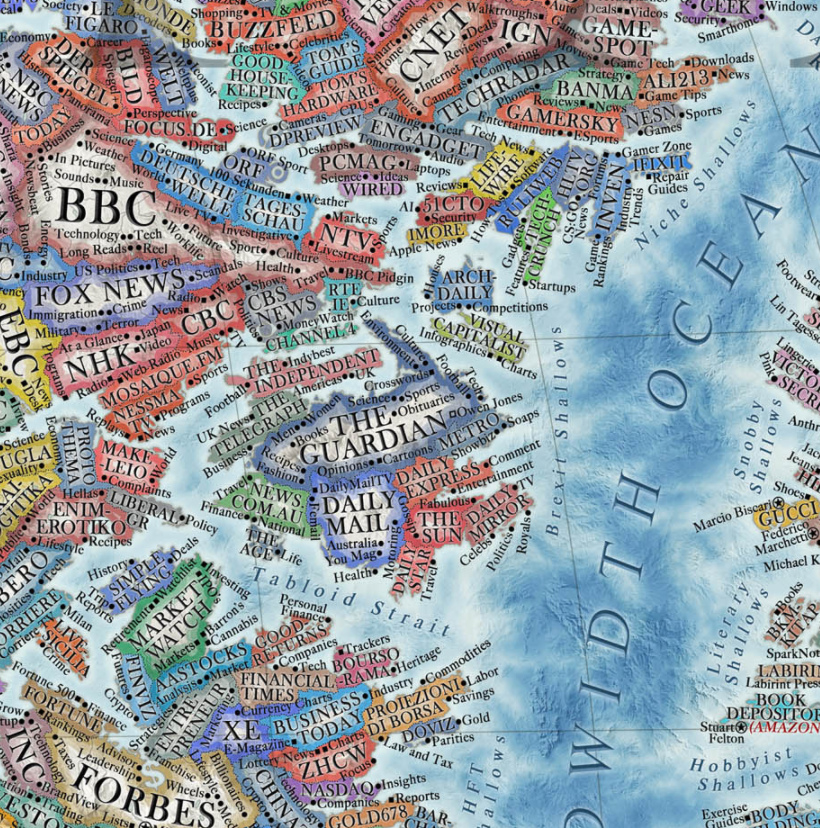 Editor’s fun fact: Can you spot Visual Capitalist? We’re right in between TechCrunch and The Guardian above.
The colored borders represent a website’s logo or user interface. In terms of scale, each website’s territory size is based on its average Alexa web traffic ranking. The data is a yearly average, measured from January 2020 to January 2021.
Along the borders of the map, you can find additional information, from ranked lists of social media consumption to a mini-map of average download speeds across the globe.
According to the designer Martin Vargic, this map took about a year to complete.
Top 50 Most Popular Websites
Google and YouTube take up a lot of space, which is unsurprising—they’re the two highest-ranked websites on the list:
| Rank | Website | Country |
|---|---|---|
| 1 | Google.com | 🇺🇲 U.S. |
| 2 | Youtube.com | 🇺🇲 U.S. |
| 3 | Tmall.com | 🇨🇳 China |
| 4 | Baidu.com | 🇨🇳 China |
| 5 | QQ.com | 🇨🇳 China |
| 6 | Sohu.com | 🇨🇳 China |
| 7 | Facebook.com | 🇺🇲 U.S. |
| 8 | Taobao.com | 🇨🇳 China |
| 9 | Amazon.com | 🇺🇲 U.S. |
| 10 | 360.cn | 🇨🇳 China |
| 11 | Yahoo.com | 🇺🇲 U.S. |
| 12 | Jd.com | 🇨🇳 China |
| 13 | Zoom.us | 🇺🇲 U.S. |
| 14 | Wikipedia.com | 🇺🇲 U.S. |
| 15 | Weibo.com | 🇨🇳 China |
| 16 | Sina.com.cn | 🇨🇳 China |
| 17 | Live.com | 🇺🇲 U.S. |
| 18 | Xinhuanet.com | 🇨🇳 China |
| 19 | Microsoft.com | 🇺🇲 U.S. |
| 20 | Reddit.com | 🇺🇲 U.S. |
| 21 | Office.com | 🇺🇲 U.S. |
| 22 | Netflix.com | 🇺🇲 U.S. |
| 23 | Microsoftonline.com | 🇺🇲 U.S. |
| 24 | Panda.tv | 🇨🇳 China |
| 25 | Zhanqi.tv | 🇨🇳 China |
| 26 | Instagram.com | 🇺🇲 U.S. |
| 27 | Force.com | 🇺🇲 U.S. |
| 28 | Google.com.hk | 🇭🇰 Hong Kong |
| 29 | VK.com | 🇷🇺 Russia |
| 30 | Alipay.com | 🇨🇳 China |
| 31 | Csdn.net | 🇨🇳 China |
| 32 | Myshopify.com | 🇨🇦 Canada |
| 33 | Okezone.com | 🇮🇩 Indonesia |
| 34 | Bing.com | 🇺🇲 U.S. |
| 35 | Yahoo.co.jp | 🇯🇵 Japan |
| 36 | Naver.com | 🇰🇷 South Korea |
| 37 | Adobe.com | 🇺🇲 U.S. |
| 38 | Salesforce.com | 🇺🇲 U.S. |
| 39 | Ebay.com | 🇺🇲 U.S. |
| 40 | Twitch.tv | 🇺🇲 U.S. |
| 41 | Bongacams.com | 🇳🇱 Netherlands |
| 42 | Twitter.com | 🇺🇲 U.S. |
| 43 | Apple.com | 🇺🇲 U.S. |
| 44 | Amazon.in | 🇮🇳 India |
| 45 | Amazon.co.jp | 🇯🇵 Japan |
| 46 | Aliexpress.com | 🇨🇳 China |
| 47 | Aparat.com | 🇮🇷 Iran |
| 48 | Linkedin.com | 🇺🇲 U.S. |
| 49 | Huanqiu.com | 🇨🇳 China |
| 50 | YY.com | 🇨🇳 China |
Google has held the title as the internet’s most popular website since 2010. While Google’s popularity is well understood, the company’s dominance might be even more widespread than you’d think—across all Google-owned platforms (including YouTube) the company accounts for 90% of all internet searches.
The third highest ranked website is Tmall. For those who don’t know, Tmall is a Chinese e-commerce platform, owned by Alibaba Group. It focuses on Business-to-Consumer (B2C) transactions, and has established itself as the most popular e-commerce website in China—in Q1 2021, Tmall accounted for more than 50% of China’s B2C online transactions.
A High Level Look
When it comes to the top 50 websites overall, a majority are either social networking platforms, search engines, or online marketplaces—while this may not come as a surprise, it’s still powerful to see visualized. For instance, even a huge, well-known website like the New York Times is just a tiny country on this map.
And of course, a map of the internet isn’t complete without mention of the dark web.
While it’s challenging to determine its true size, research indicates that the dark web accounts for a large portion of the internet’s true size. And apparently, it’s growing steadily, with the help of anonymous cryptocurrencies like Bitcoin.
For the most part, it’s believed that the dark web is used for unsavory reasons—however, it’s not all bad. Because of its anonymous nature, it can be used as a safe space for whistleblowing or activism.
Overall, this map, and the internet as a whole, has many places for us to explore. When you dive in, what “countries” catch your eye?


Technology
Mapped: Internet Freedom Around the World in 2026
The Internet has reshaped the world. But your access can vary greatly based on the country in which you live.


Mapped: Internet Freedom Around the World in 2026
See visuals like this from many other data creators on our Voronoi app. Download it for free on iOS or Android and discover data-driven charts from a variety of trusted sources.
Key Takeaways
- 11 countries tie for the world’s freest internet (score: 92), spanning Europe, Latin America, and Asia.
- North Korea ranks last (0), with China, Russia, Iran, and Pakistan close behind (4).
- The U.S. (64) and UK (52) rank mid-pack, trailing leaders like Norway and Costa Rica.
How free is the internet where you live?
This map ranks 171 countries based on how freely people can access the internet. The results reveal stark global differences, from highly open systems in parts of Europe and Latin America to tightly controlled networks in countries like North Korea and China.
The data comes from a 2026 internet freedom index by Cloudwards, which evaluates national policies across four areas: torrenting, VPN availability, adult content, and political and civic expression.
Where Does the U.S. Rank?
The United States scores 64 out of 100, placing it in the global middle. It ranks alongside countries like Japan and Australia, and below top performers such as Norway (92) and Canada (84).
The UK scores even lower at 52, reflecting stricter regulations in areas like online content access.
The Freest Internet Access Worldwide
No country achieves a perfect score, but 11 countries across four continents share the top spot at 92.
These countries are Belgium, Costa Rica, Denmark, Finland, Iceland, Liechtenstein, New Zealand, Norway, Slovakia, Suriname, and Timor-Leste.
The data table below lists countries worldwide alongside their internet freedom scores.
| Country | Internet Freedom Score |
|---|---|
| 🇧🇪 Belgium | 92 |
| 🇨🇷 Costa Rica | 92 |
| 🇩🇰 Denmark | 92 |
| 🇫🇮 Finland | 92 |
| 🇮🇸 Iceland | 92 |
| 🇱🇮 Liechtenstein | 92 |
| 🇳🇿 New Zealand | 92 |
| 🇳🇴 Norway | 92 |
| 🇸🇰 Slovakia | 92 |
| 🇸🇷 Suriname | 92 |
| 🇹🇱 Timor-Leste | 92 |
| 🇦🇩 Andorra | 84 |
| 🇦🇹 Austria | 84 |
| 🇧🇿 Belize | 84 |
| 🇨🇦 Canada | 84 |
| 🇨🇻 Cape Verde | 84 |
| 🇨🇱 Chile | 84 |
| 🇨🇮 Côte d’Ivoire | 84 |
| 🇭🇷 Croatia | 84 |
| 🇩🇴 Dominican Republic | 84 |
| 🇬🇷 Greece | 84 |
| 🇬🇾 Guyana | 84 |
| 🇭🇹 Haiti | 84 |
| 🇯🇲 Jamaica | 84 |
| 🇽🇰 Kosovo | 84 |
| 🇱🇹 Lithuania | 84 |
| 🇱🇺 Luxembourg | 84 |
| 🇲🇹 Malta | 84 |
| 🇲🇩 Moldova | 84 |
| 🇲🇪 Montenegro | 84 |
| 🇲🇰 North Macedonia | 84 |
| 🇵🇦 Panama | 84 |
| 🇵🇱 Poland | 84 |
| 🇸🇨 Seychelles | 84 |
| 🇸🇮 Slovenia | 84 |
| 🇨🇭 Switzerland | 84 |
| 🇹🇹 Trinidad & Tobago | 84 |
| 🇺🇾 Uruguay | 84 |
| 🇮🇪 Ireland | 80 |
| 🇱🇻 Latvia | 80 |
| 🇵🇹 Portugal | 80 |
| 🇸🇪 Sweden | 80 |
| 🇦🇷 Argentina | 76 |
| 🇧🇯 Benin | 76 |
| 🇧🇴 Bolivia | 76 |
| 🇧🇦 Bosnia & Herzegovina | 76 |
| 🇨🇾 Cyprus | 76 |
| 🇫🇯 Fiji | 76 |
| 🇬🇲 Gambia | 76 |
| 🇭🇺 Hungary | 76 |
| 🇱🇷 Liberia | 76 |
| 🇲🇬 Madagascar | 76 |
| 🇲🇳 Mongolia | 76 |
| 🇳🇦 Namibia | 76 |
| 🇳🇪 Niger | 76 |
| 🇵🇪 Peru | 76 |
| 🇧🇬 Bulgaria | 72 |
| 🇪🇪 Estonia | 72 |
| 🇬🇭 Ghana | 72 |
| 🇬🇹 Guatemala | 72 |
| 🇮🇹 Italy | 72 |
| 🇲🇽 Mexico | 72 |
| 🇳🇱 Netherlands | 72 |
| 🇵🇾 Paraguay | 72 |
| 🇪🇸 Spain | 72 |
| 🇹🇼 Taiwan | 72 |
| 🇦🇴 Angola | 68 |
| 🇨🇩 Democratic Republic of Congo | 68 |
| 🇬🇦 Gabon | 68 |
| 🇲🇼 Malawi | 68 |
| 🇲🇱 Mali | 68 |
| 🇲🇺 Mauritius | 68 |
| 🇲🇿 Mozambique | 68 |
| 🇵🇬 Papua New Guinea | 68 |
| 🇨🇬 Republic of the Congo | 68 |
| 🇸🇳 Senegal | 68 |
| 🇦🇱 Albania | 64 |
| 🇦🇺 Australia | 64 |
| 🇧🇼 Botswana | 64 |
| 🇨🇫 Central African Republic | 64 |
| 🇪🇨 Ecuador | 64 |
| 🇫🇷 France | 64 |
| 🇬🇪 Georgia | 64 |
| 🇩🇪 Germany | 64 |
| 🇬🇼 Guinea-Bissau | 64 |
| 🇭🇳 Honduras | 64 |
| 🇭🇰 Hong Kong SAR China | 64 |
| 🇯🇵 Japan | 64 |
| 🇱🇸 Lesotho | 64 |
| 🇲🇻 Maldives | 64 |
| 🇲🇦 Morocco | 64 |
| 🇳🇮 Nicaragua | 64 |
| 🇳🇬 Nigeria | 64 |
| 🇷🇴 Romania | 64 |
| 🇷🇸 Serbia | 64 |
| 🇿🇦 South Africa | 64 |
| 🇺🇸 United States | 64 |
| 🇲🇷 Mauritania | 60 |
| 🇦🇲 Armenia | 56 |
| 🇧🇮 Burundi | 56 |
| 🇨🇲 Cameroon | 56 |
| 🇹🇩 Chad | 56 |
| 🇸🇿 Eswatini | 56 |
| 🇬🇳 Guinea | 56 |
| 🇱🇧 Lebanon | 56 |
| 🇵🇸 Palestine | 56 |
| 🇵🇭 Philippines | 56 |
| 🇷🇼 Rwanda | 56 |
| 🇹🇯 Tajikistan | 56 |
| 🇹🇳 Tunisia | 56 |
| 🇧🇹 Bhutan | 52 |
| 🇧🇷 Brazil | 52 |
| 🇨🇴 Colombia | 52 |
| 🇰🇪 Kenya | 52 |
| 🇰🇬 Kyrgyzstan | 52 |
| 🇬🇧 United Kingdom | 52 |
| 🇿🇲 Zambia | 52 |
| 🇩🇿 Algeria | 48 |
| 🇧🇫 Burkina Faso | 48 |
| 🇩🇯 Djibouti | 48 |
| 🇳🇵 Nepal | 48 |
| 🇱🇰 Sri Lanka | 48 |
| 🇹🇴 Tongo | 48 |
| 🇿🇼 Zimbabwe | 48 |
| 🇰🇭 Cambodia | 44 |
| 🇸🇻 El Salvador | 44 |
| 🇮🇱 Israel | 44 |
| 🇸🇴 Somalia | 44 |
| 🇺🇦 Ukraine | 44 |
| 🇦🇿 Azerbaijan | 36 |
| 🇨🇺 Cuba | 36 |
| 🇬🇶 Equatorial Guinea | 36 |
| 🇪🇹 Ethiopia | 36 |
| 🇯🇴 Jordan | 36 |
| 🇰🇿 Kazakhstan | 36 |
| 🇰🇼 Kuwait | 36 |
| 🇱🇦 Laos | 36 |
| 🇹🇭 Thailand | 36 |
| 🇻🇪 Venezuela | 36 |
| 🇧🇭 Bahrain | 32 |
| 🇲🇾 Malaysia | 32 |
| 🇸🇬 Singapore | 32 |
| 🇰🇷 South Korea | 32 |
| 🇱🇾 Libya | 28 |
| 🇹🇿 Tanzania | 28 |
| 🇦🇫 Afghanistan | 24 |
| 🇧🇳 Brunei | 24 |
| 🇮🇩 Indonesia | 24 |
| 🇶🇦 Qatar | 24 |
| 🇺🇬 Uganda | 24 |
| 🇺🇿 Uzbekistan | 24 |
| 🇻🇳 Vietnam | 24 |
| 🇧🇩 Bangladesh | 20 |
| 🇧🇾 Belarus | 20 |
| 🇴🇲 Oman | 20 |
| 🇮🇶 Iraq | 16 |
| 🇲🇲 Myanmar (Burma) | 16 |
| 🇹🇲 Turkmenistan | 16 |
| 🇪🇬 Egypt | 12 |
| 🇮🇳 India | 12 |
| 🇸🇦 Saudi Arabia | 12 |
| 🇸🇩 Sudan | 12 |
| 🇸🇾 Syria | 12 |
| 🇹🇷 Türkiye | 12 |
| 🇦🇪 United Arab Emirates | 12 |
| 🇾🇪 Yemen | 12 |
| 🇨🇳 China | 4 |
| 🇮🇷 Iran | 4 |
| 🇵🇰 Pakistan | 4 |
| 🇷🇺 Russia | 4 |
| 🇰🇵 North Korea | 0 |
European countries make up over half of this top echelon and are especially concentrated in the Nordics, where Sweden (80) is the only exception. The Nordic countries are widely known for their liberal, tolerant governments and societies.
Perhaps more surprising is the high placement of countries like Suriname and Timor-Leste, developing nations in South America and Asia that have nonetheless imposed minimal restrictions on social media use and online access.
The Bottom of the Scoreboard
On the other side of the spectrum is North Korea (0), where very few citizens have access to the global internet. Instead, most rely on the national intranet service, Kwangmyong, which filters out outside information.
Right behind North Korea are China and Russia, which tie with Iran and Pakistan for the next-lowest scores worldwide (4).
China’s Great Firewall is perhaps the world’s best-known censorship system, used to suppress criticism of the country’s leaders or content related to politically sensitive topics such as the Tiananmen Square protests. It also blocks access to foreign platforms like Facebook and YouTube.
Internet Access in the West
The United States (64) sits near the middle of the ranking, alongside developed democracies such as Australia, France, Germany, and Japan. The United Kingdom (52) scores slightly lower, with recent adult content legislation playing a role.
Across much of the Western world, scores remain relatively high, including in Canada (84), Ireland and Portugal (both 80), and Spain and Italy (both 72).
One notable outlier is South Korea (32), which ranks below countries like Cuba, Kazakhstan, and Venezuela (36), underscoring how content restrictions—not just political systems—shape internet freedom scores.
Learn More on the Voronoi App 
If you enjoyed today’s post, check out A Day of Activity on the Internet on Voronoi.Use This Visualization
Money
Mapped: Average Rent Across 100 U.S. Cities (2026)
Six of the top ten most expensive rental markets are in California.


Mapped: Average Rent Across 100 U.S. Cities (2026)
See visuals like this from many other data creators on our Voronoi app. Download it for free on iOS or Android and discover incredible data-driven charts from a variety of trusted sources.
Key Takeaways
- San Francisco, New York, and Boston top U.S. rents at over $3,500 a month.
- Six of the 10 most expensive rental markets are in California.
- The average across 100 cities is $1,843, with many Midwest and Southern cities below $1,200.
Rents across 100 U.S. cities range widely in 2026, from over $3,500 in the most expensive markets to around $1,200 in more affordable regions.
This map visualizes average monthly rent using Zillow’s Observed Rent Index (ZORI), via WalletHub. The data reflects smoothed, seasonally adjusted rents across all residential property types as of February 2026.
With the U.S. average at $1,843, renters in the most expensive cities are paying more than double the national benchmark.
California Accounts for Most of the Highest Rents
California cities dominate the upper end of the rental market, accounting for six of the 10 most expensive locations.
| Rank | City | Average Rent (2026) |
|---|---|---|
| 1 | San Francisco, CA | $3,830 |
| 2 | New York, NY | $3,706 |
| 3 | Boston, MA | $3,510 |
| 4 | Irvine, CA | $3,361 |
| 5 | San Jose, CA | $3,222 |
| 6 | Jersey City, NJ | $3,048 |
| 7 | Miami, FL | $2,964 |
| 8 | Chula Vista, CA | $2,904 |
| 9 | San Diego, CA | $2,893 |
| 10 | Santa Ana, CA | $2,804 |
| 11 | Los Angeles, CA | $2,742 |
| 12 | Anaheim, CA | $2,711 |
| 13 | Naples, FL | $2,677 |
| 14 | Honolulu, HI | $2,548 |
| 15 | Oakland, CA | $2,527 |
| 16 | Washington, DC | $2,406 |
| 17 | Riverside, CA | $2,346 |
| 18 | Chicago, IL | $2,292 |
| 19 | Long Beach, CA | $2,287 |
| 20 | Seattle, WA | $2,187 |
| 21 | Newark, NJ | $2,121 |
| 22 | Gilbert, AZ | $2,049 |
| 23 | Saint Petersburg, FL | $2,048 |
| 24 | Modesto, CA | $2,042 |
| 25 | Stockton, CA | $2,010 |
| 26 | Sacramento, CA | $2,006 |
| 27 | Tampa, FL | $1,968 |
| 28 | Silver Spring, MD | $1,954 |
| 29 | Virginia Beach, VA | $1,953 |
| 30 | Katy, TX | $1,896 |
| 31 | Atlanta, GA | $1,888 |
| 32 | Bakersfield, CA | $1,887 |
| 33 | Lawrenceville, GA | $1,881 |
| 34 | Orlando, FL | $1,857 |
| 35 | Chandler, AZ | $1,848 |
| 36 | Reno, NV | $1,830 |
| 37 | Denver, CO | $1,818 |
| 38 | Nashville, TN | $1,772 |
| 39 | Henderson, NV | $1,772 |
| 40 | Vancouver, WA | $1,769 |
| 41 | Marietta, GA | $1,742 |
| 42 | Philadelphia, PA | $1,734 |
| 43 | Plano, TX | $1,717 |
| 44 | Portland, OR | $1,710 |
| 45 | Baltimore, MD | $1,708 |
| 46 | Knoxville, TN | $1,708 |
| 47 | Charlotte, NC | $1,705 |
| 48 | Boise, ID | $1,703 |
| 49 | Las Vegas, NV | $1,695 |
| 50 | Fresno, CA | $1,693 |
| 51 | Aurora, CO | $1,689 |
| 52 | Spring, TX | $1,679 |
| 53 | Colorado Springs, CO | $1,667 |
| 54 | Durham, NC | $1,651 |
| 55 | Minneapolis, MN | $1,638 |
| 56 | New Orleans, LA | $1,625 |
| 57 | Dallas, TX | $1,591 |
| 58 | Jacksonville, FL | $1,576 |
| 59 | Richmond, VA | $1,574 |
| 60 | Raleigh, NC | $1,567 |
| 61 | Phoenix, AZ | $1,556 |
| 62 | Fort Worth, TX | $1,554 |
| 63 | Mesa, AZ | $1,554 |
| 64 | Houston, TX | $1,542 |
| 65 | Austin, TX | $1,531 |
| 66 | Pittsburgh, PA | $1,516 |
| 67 | Lexington, KY | $1,487 |
| 68 | Saint Paul, MN | $1,485 |
| 69 | Tallahassee, FL | $1,484 |
| 70 | Arlington, TX | $1,462 |
| 71 | Columbia, SC | $1,459 |
| 72 | Albuquerque, NM | $1,457 |
| 73 | Spokane, WA | $1,456 |
| 74 | Winston-Salem, NC | $1,445 |
| 75 | El Paso, TX | $1,441 |
| 76 | Rochester, NY | $1,434 |
| 77 | Corpus Christi, TX | $1,433 |
| 78 | Cincinnati, OH | $1,425 |
| 79 | Kansas City, MO | $1,418 |
| 80 | Columbus, OH | $1,415 |
| 81 | Omaha, NE | $1,403 |
| 82 | Tucson, AZ | $1,399 |
| 83 | Milwaukee, WI | $1,398 |
| 84 | Lubbock, TX | $1,388 |
| 85 | Greensboro, NC | $1,382 |
| 86 | Buffalo, NY | $1,381 |
| 87 | San Antonio, TX | $1,361 |
| 88 | Indianapolis, IN | $1,356 |
| 89 | Louisville, KY | $1,352 |
| 90 | Cleveland, OH | $1,344 |
| 91 | Saint Louis, MO | $1,326 |
| 92 | Detroit, MI | $1,318 |
| 93 | Baton Rouge, LA | $1,312 |
| 94 | Lincoln, NE | $1,293 |
| 95 | Oklahoma City, OK | $1,255 |
| 96 | Memphis, TN | $1,234 |
| 97 | Tulsa, OK | $1,207 |
| 98 | Fort Wayne, IN | $1,160 |
| 99 | Wichita, KS | $1,125 |
| 100 | Toledo, OH | $1,060 |
| -- | 🇺🇸 U.S. Average (100 Cities) | $1,843 |
At $3,830 per month, San Francisco renters pay more than twice the national average, putting it at the top of the ranking alongside New York and Boston, where rents also exceed $3,500.
Other California cities like Irvine, San Jose, and San Diego also rank near the top. High demand, limited housing supply, and strong local economies continue to drive elevated prices across the state.
Coastal Premiums Remain Intact
Beyond California, other coastal cities also command high rents. New York City and Jersey City remain among the most expensive, reflecting their proximity to major job centers.
Miami has also emerged as one of the priciest markets in the Southeast, fueled by population growth and migration trends.
Affordability Concentrated in the Interior
In contrast, the most affordable rental markets are largely located in the Midwest and South.
In cities like Toledo, Wichita, and Tulsa, average rents remain near or below $1,200, roughly one-third the cost of renting in San Francisco. This gap highlights how location alone can dramatically change a renter’s cost of living, even within the same country.
Learn More on the Voronoi App
If you enjoyed today’s post, check out It Takes 25 Years to Save for a Home in California on Voronoi, the new app from Visual Capitalist.
-
 War3 weeks ago
Ranked: The World’s Largest Armies in 2026
-
Maps2 weeks ago
Mapped: Where Wealth Is Moving in America
-
Misc2 weeks ago
Ranked: The 20 Tallest Buildings in the World
-
Maps1 week ago
Mapped: The Cost of Living Across America
-
Money4 days ago
Mapped: What It Takes to Be Upper-Middle Class in Every State
-
Economy7 days ago
Ranked: The Most Productive Countries in the World
-
Money1 week ago
Mapped: The Salary Needed to Live Comfortably in U.S. Cities
-
Military2 weeks ago
Ranked: The World’s Largest Air Forces in 2026


