
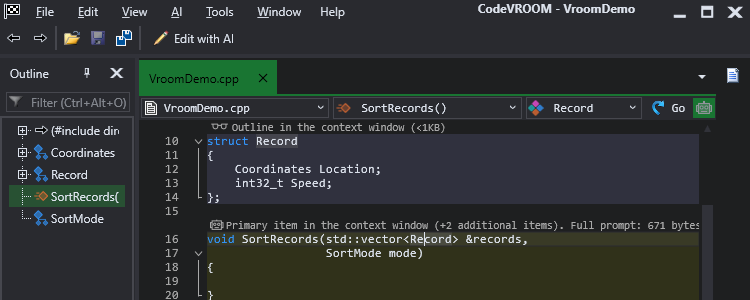
Advanced Debugging GUI
CodeVROOM is designed to make debugging easy and fast, featuring:
- Non-intrusive Live Watch integrated in debugger tooltips
- Individually managed Watch window presets
- Advanced Peripheral Register view
- Real-time globals and RTOS objects views
- Advanced call stack view with frame sizes and targets
- Instantly searchable thread list with frames

Advanced Data Visualization
CodeVROOM natively supports visualization and analysis of the debugged data through the Graph views:
- Non-intrusively monitor live variable values
- Record, plot, analyze statistics on recorded data
- View large arrays as graphs through regular debug value popups
Plotting natively works on Windows, Linux and Mac, supports embedded and native projects.

Out-of-the-box Embedded Device Support
CodeVROOM includes out-of-the-box support for numerous embedded devices via the VisualGDB device packages and provides special project types for:
- ESP32 projects using the ESP-IDF
- Raspberry Pi Pico projects based on PicoSDK
- Renesas RA devices using the Renesas Smart Configurator

Advanced Settings GUI
CodeVROOM includes advanced GUI for C/C++ settings, CMake target properties, build settings, debug settings, and many more.
Based on the cross-platform Avalonia framework, it brings consistent UI on Windows, Linux and MacOS alike.

